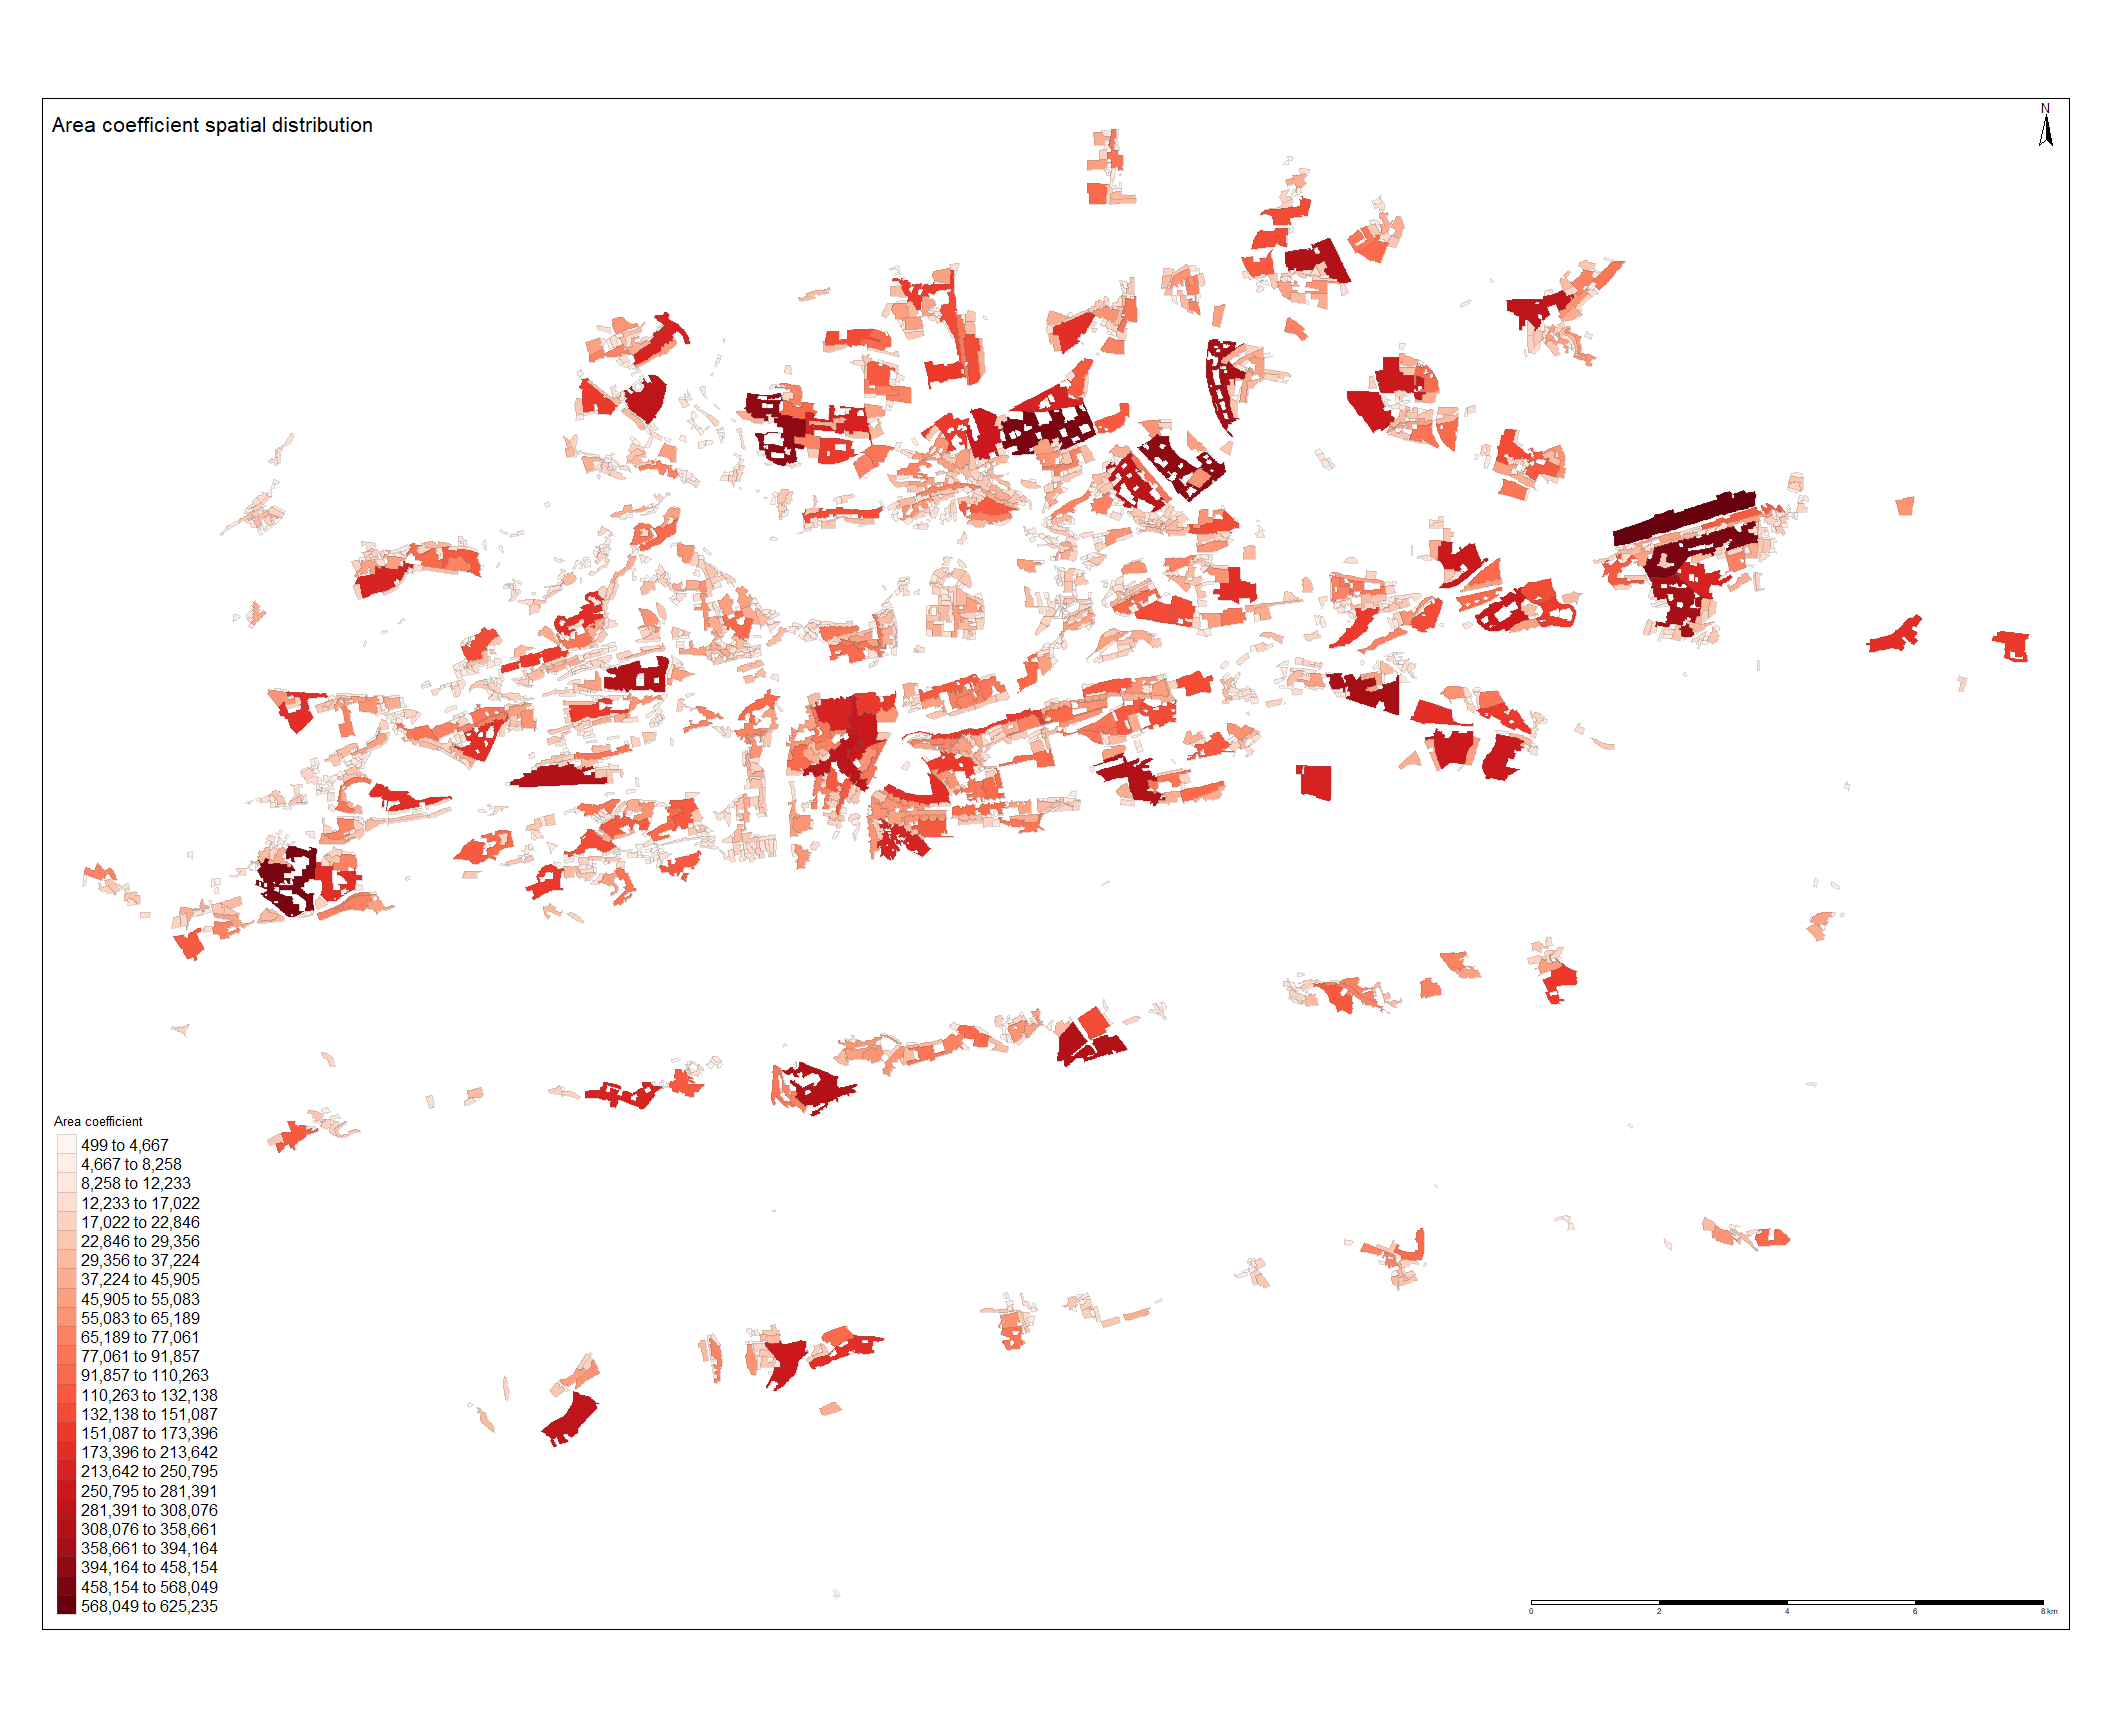
On the figure below, spatial distribution of the area coefficient estimate is ploted. The values seems to have plausible sign, indicating an increasing effect of the residential land price. Unlike for  , the highest values are not clustered in the historical city center. The highest values can be found on the eastern outskirt of the city, this is most likely to be caused by the actual polygon size as this one is the largest in the dataset. Another high values of the coefficients can be found north and west of the city center. The north area is called Troja and the west area is named Bertramka and these are the one of the most lucrative neighbourhood in the Prague consisting of luxurious mansions. The lowest values corresponds with the smallest polygons. Overall the values seems to be randomly scattered as no spatial clustering pattern is obvious.
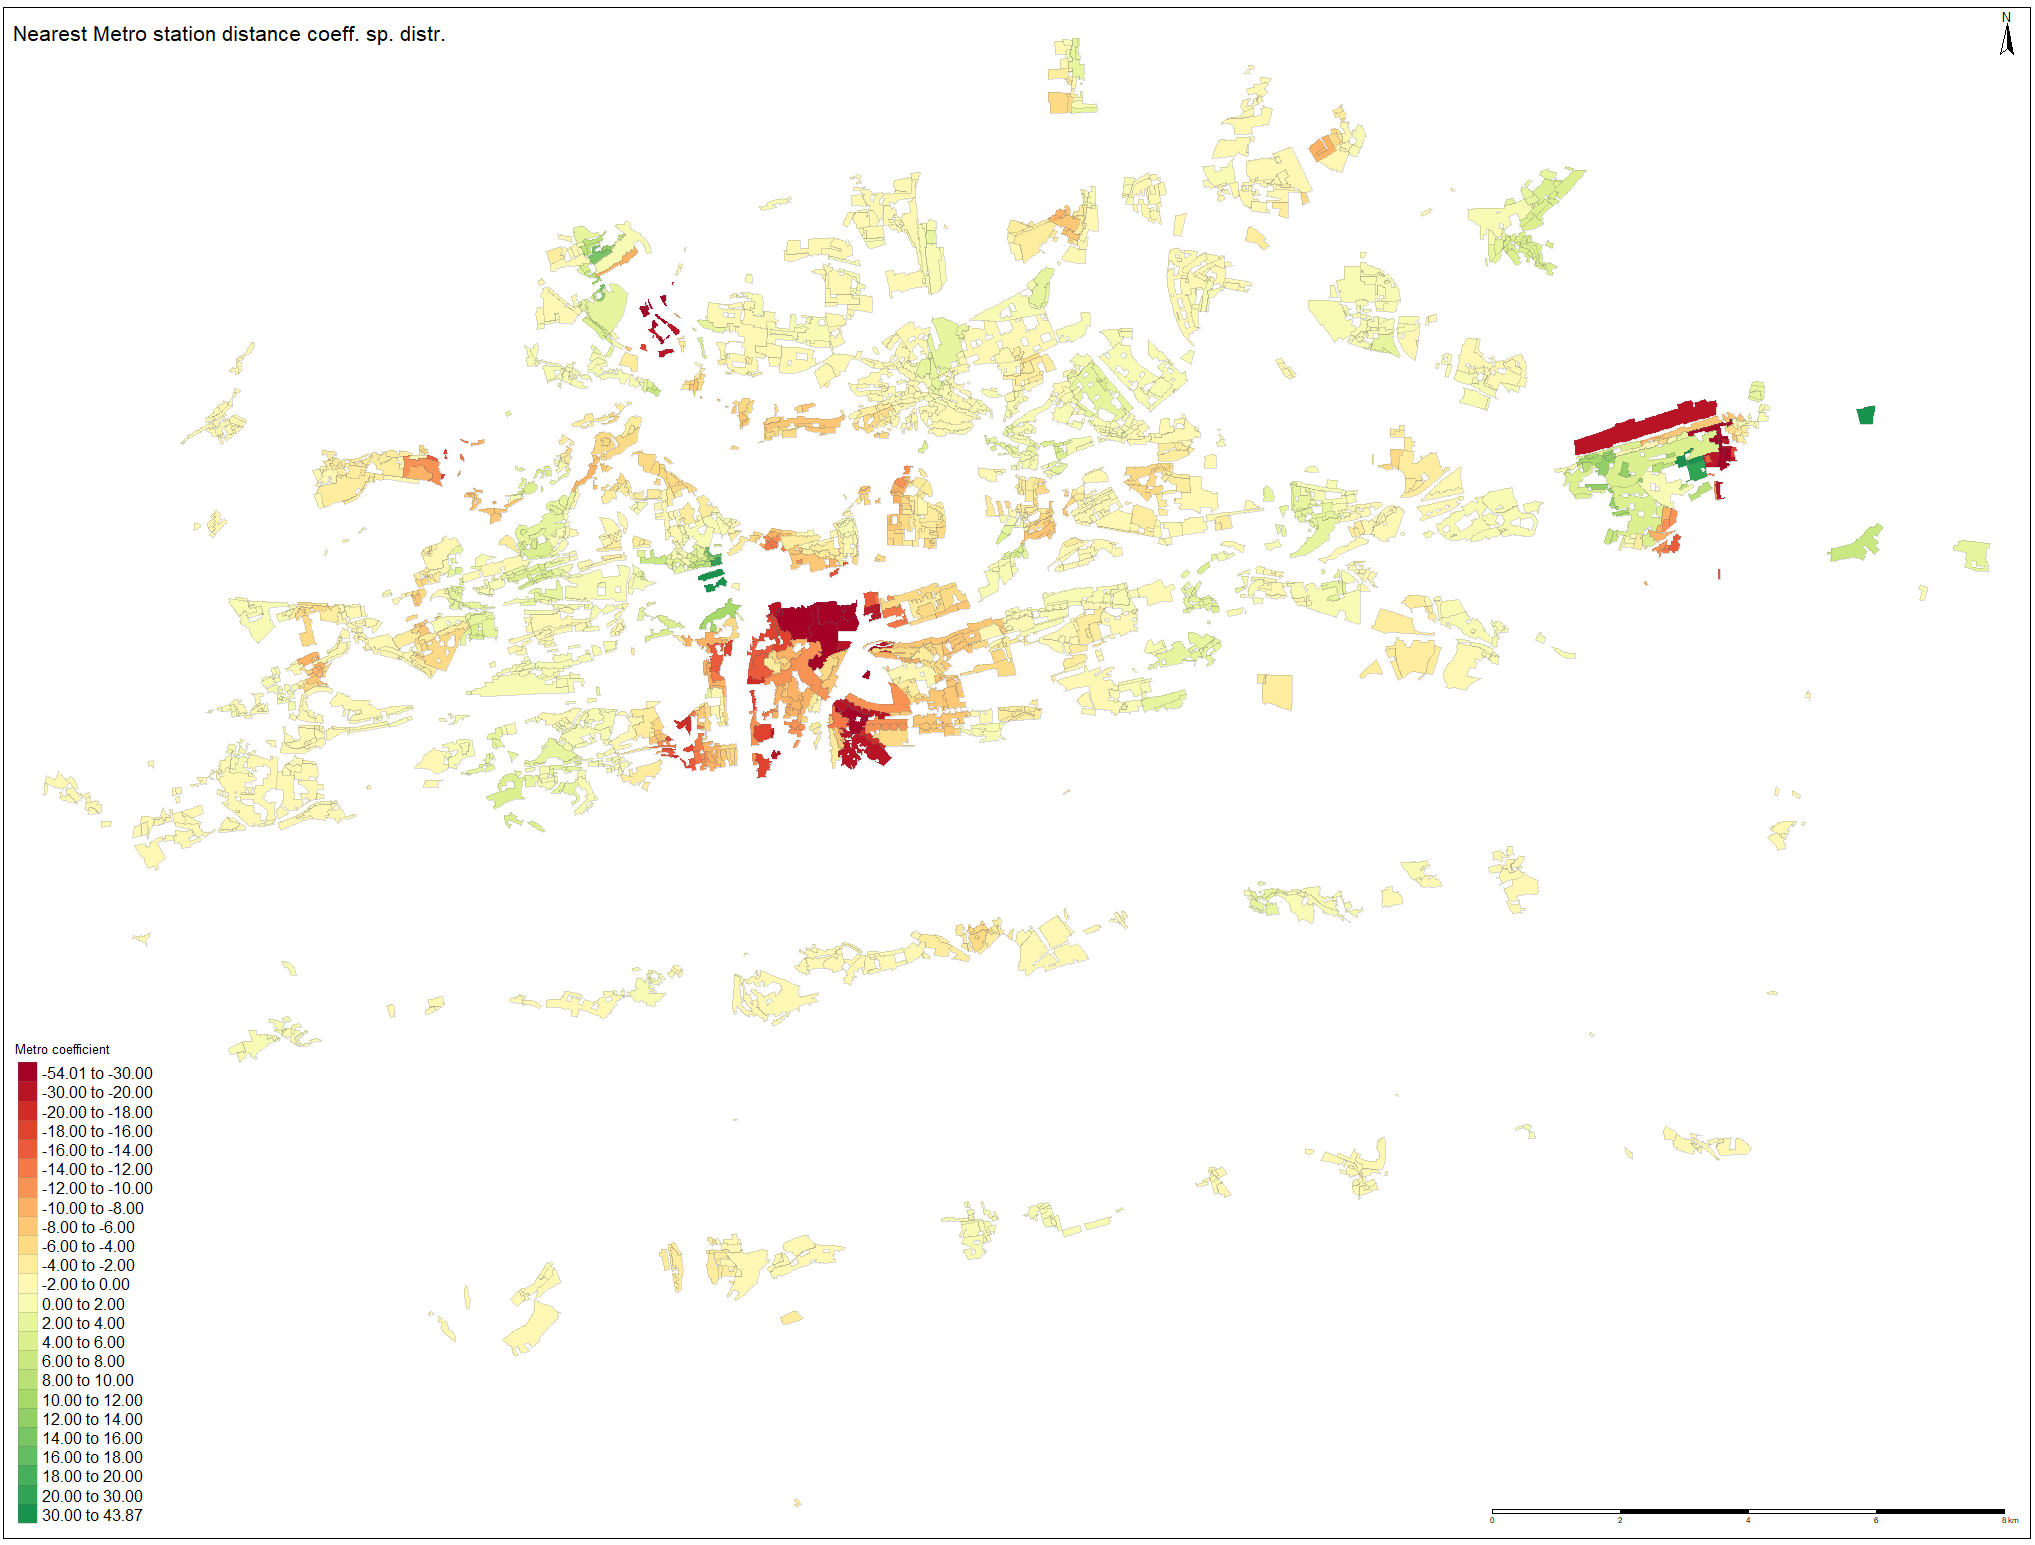
On the figures below, spatial distributions of the distance coefficients estimates are plotted. For the nearest metro distance coefficient, it can be observed that the lowest (red) values tends to be clustered in the city center. As the most valuable land is located there, it corresponds with the fact that the model assigns the strongest decreasing effect on these polygons. When going more from the center to outskirts it seems that the decreasing effect of metro distance on price tends to be weaker, as with increasing radius from city center, the polygons‘ color shade is getting lighter. Although some positively signed coefficients are present, especially in the Horní Počernice Municipality, their occurrence is not frequent. The green polygon near the city center is located very close to the Prague Castle and it is most likely affected by one of the highest price value.
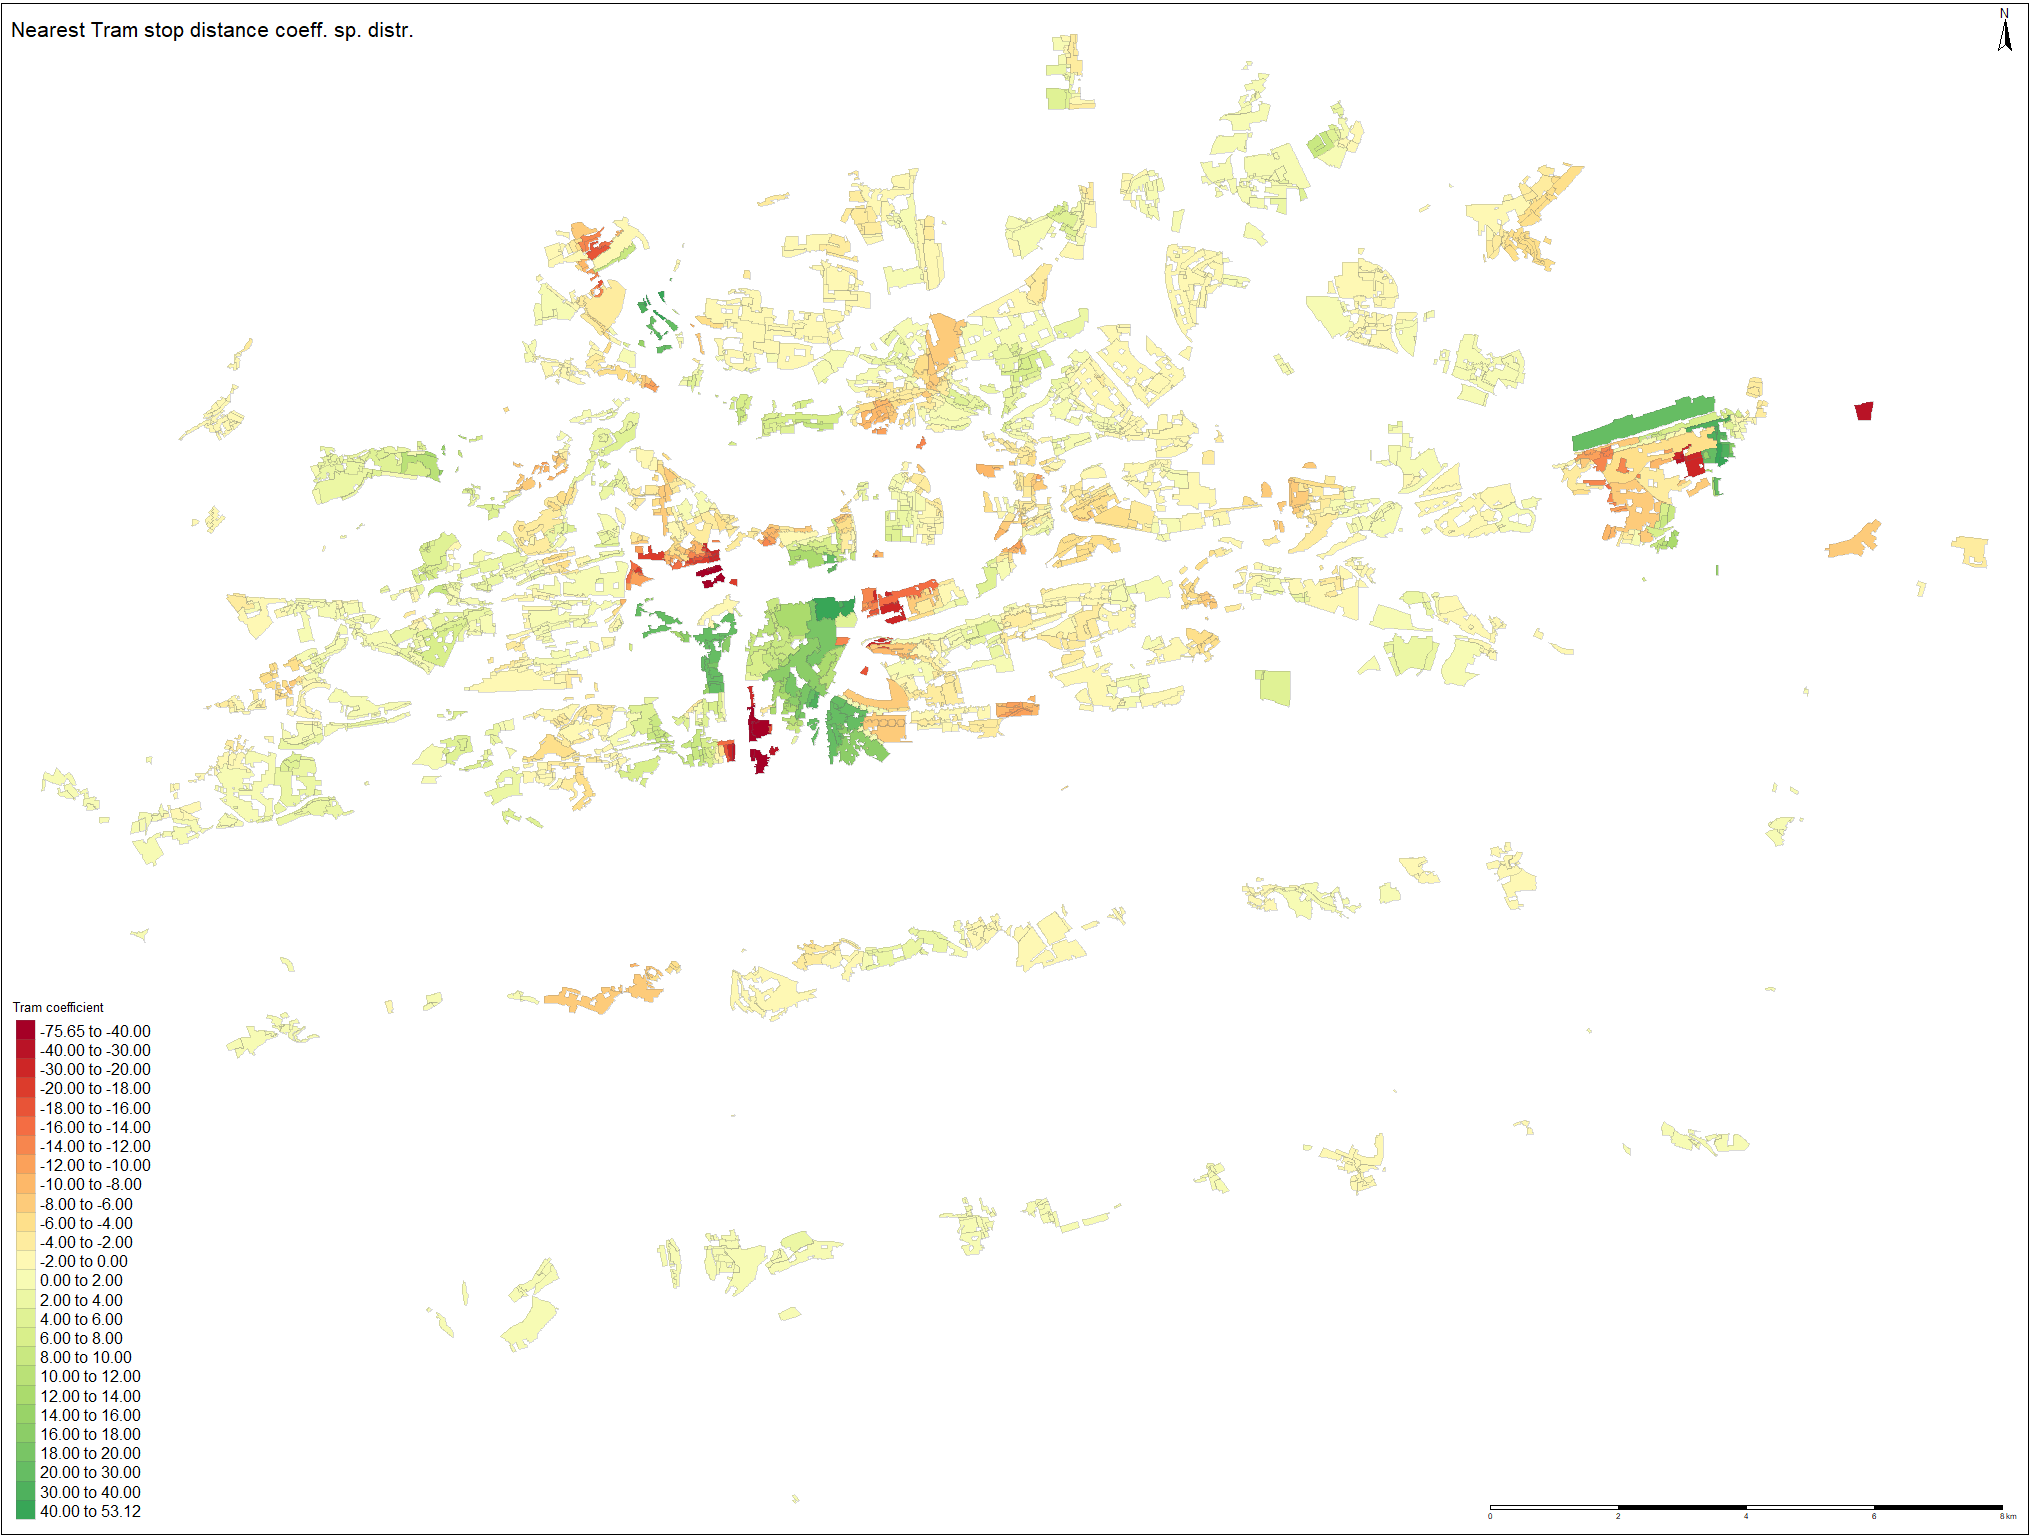
When investigating spatial distribution of the nearest tram stop distance coefficient, it can be observed that the model has assigned positively signed coefficients to the polygons in the city center. Although this not seem to be plausible result, it is most likely caused by the fact that the prices in the center are several times higher and it creates disbalances in the model. The solution can be to assign penalization for the most valuable residential land areas. However, this would have created bias in the model, violating linear relationship assumption between variables. Overall, the coefficients seems to have plausible sign on the eastern half of the city. On the western bank of the Vltava river and further, slightly positive values tends to cluster there. When comparing with metro coefficient estimates, the values for tram seems to be more randomly scattered as no buffering pattern is apparent in the distribution.
The Geographically weighted regression is a powerful tool to quantify how much the distance to nearest public transport terminal affects the residential land price. Although some limitations have appeared such as unplausible coefficients signs in some areas, in global average, the model presents plausible and realistic results.
When the multicolineratiy of the explanatory variables was found, several solutions were analyzed. By applying dimensionality reduction by Principal Component Analysis the explained variation in the data could have improved. However this solution was discarded as it would not be possible to correctly interpret, which public transport mode makes the largest contribution to the residential land price.