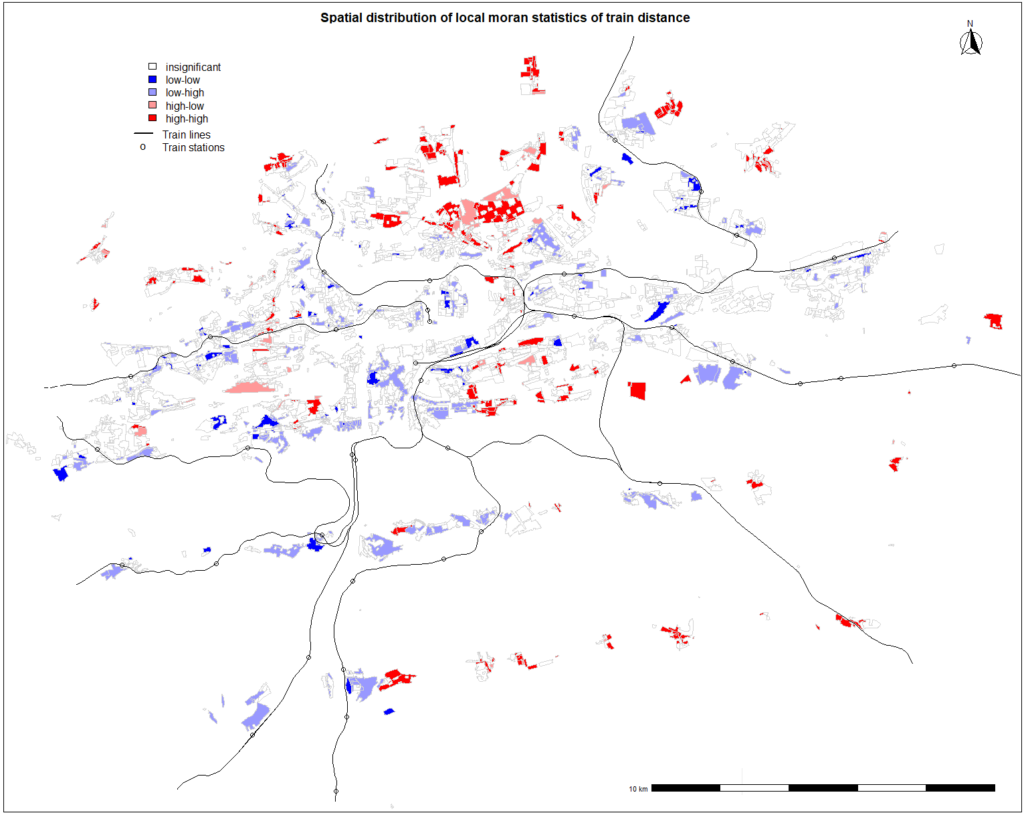
Spatial distribution of local Moran statistics for nearest train station distance is illustrated. It can be seen that the train network in Prague is shaped into a star with the main terminal (Praha Hlavní nádraží) in the city center. This corresponds with the original purpose of the system as it was designed to be used as a commuter rail for the suburban regions. There are 10 sections of the train lines that leads to Central Bohemian Region and the majority of low distance regions are aligned around them. Red polygons can be seen in the geographical center of the map however this cluster is completely surrounded by rail lines and it is well connected to other modes. North of the city center, large cluster of red polygons can be observed near Bohnice Municipality. It seems that this clustering pattern is repeating as some of these clustered areas has turned out red for buses and metro distances as well, implying poor connectivity which apparently leads to lower residential land prices in this region, concluding similar results with the findings in empirical analysis.