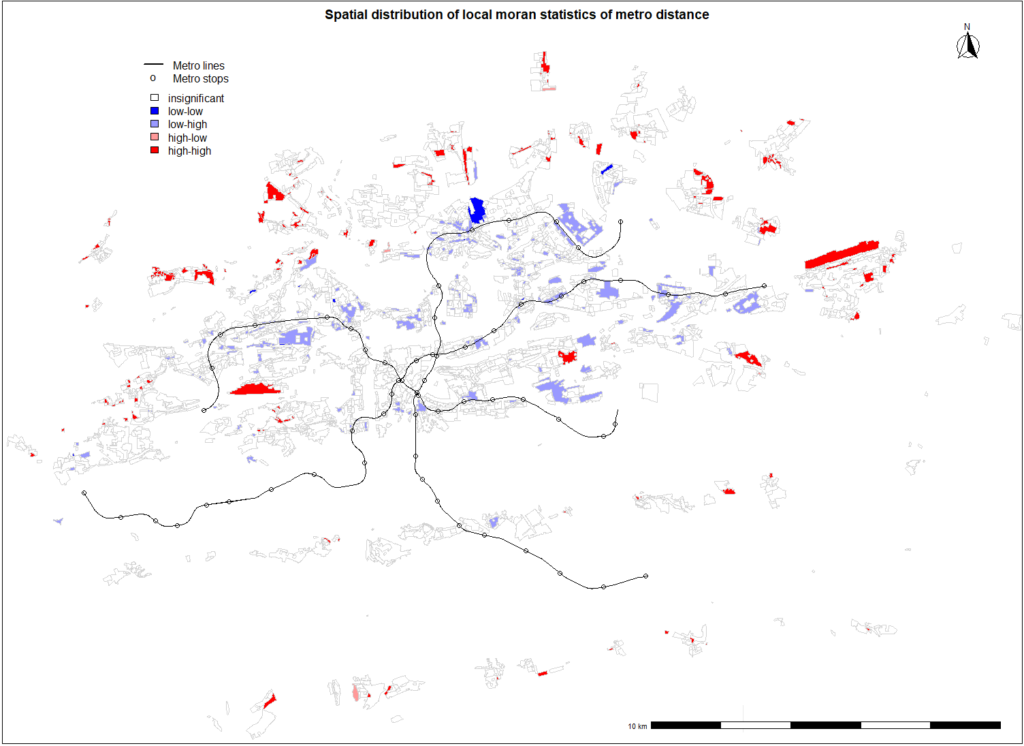
When comparing spatial distribution of local moran statistics for metro with the same statistical model for bus, different spatial variation of Moran’s values can be observed. From all statistically significant polygons, the most frequent areas are light blue, corresponding to low values areas neighbouring with those with high value of Moran statistics. As all light blue areas are aligned near metro lines, this pattern confirms empirical observations. Besides one red polygon west of the city center, any other disconnected area lies on the outskirts of the city, where metro network doesn’t reach these neighbourhood. As the city will most likely expand, this can be early indicator of necessity to build ring line in the underground transportation system.