To obtain residential land only from the Price map it is necessary to find out which polygons corresponds to residential usage.
Area Usage Plan spatial dataset from Institute of Planning and Development is used 1 to label residential polygons. This dataset contains vector polygons with encoded type of usage of the areas. For the analysis, following types of areas was used – pure residential, general residential, general mixed, city core mix. The snapshot from filtered output is plotted on the figure.
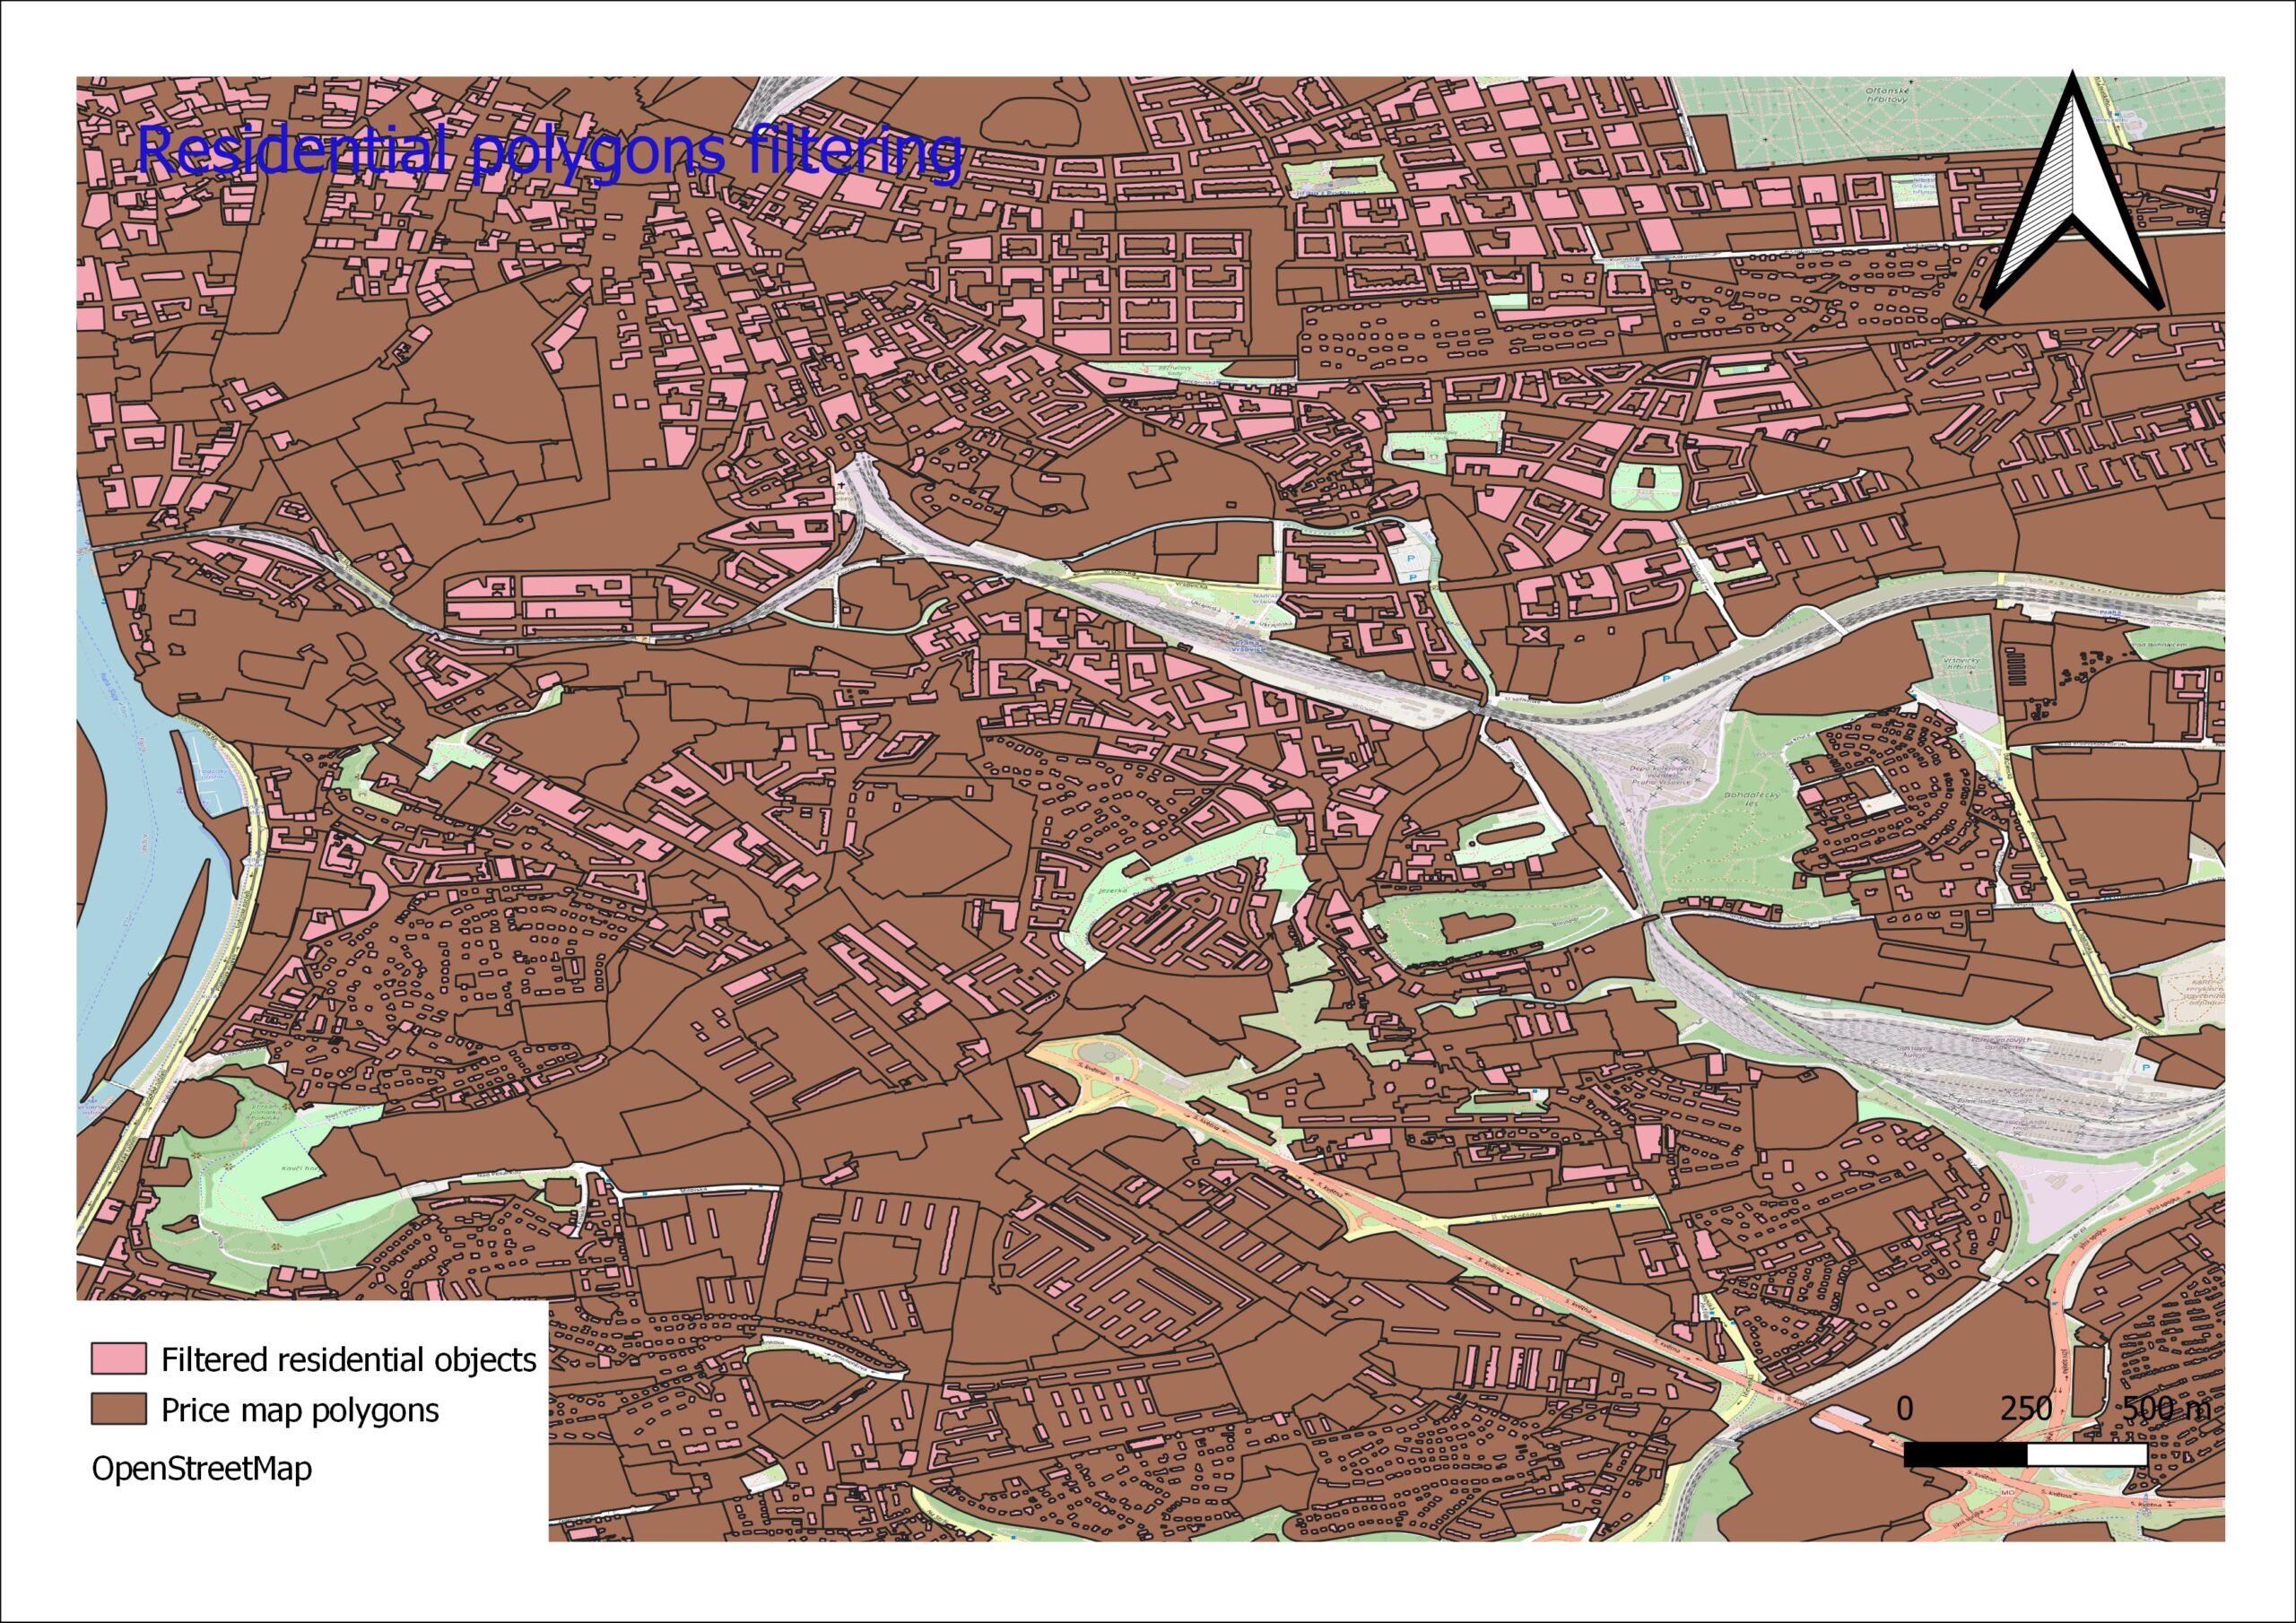
To obtain price map polygons for residential areas only, Extract By Location process in QGIS, with geometric predicate „contains“ is used as shown on the figure.

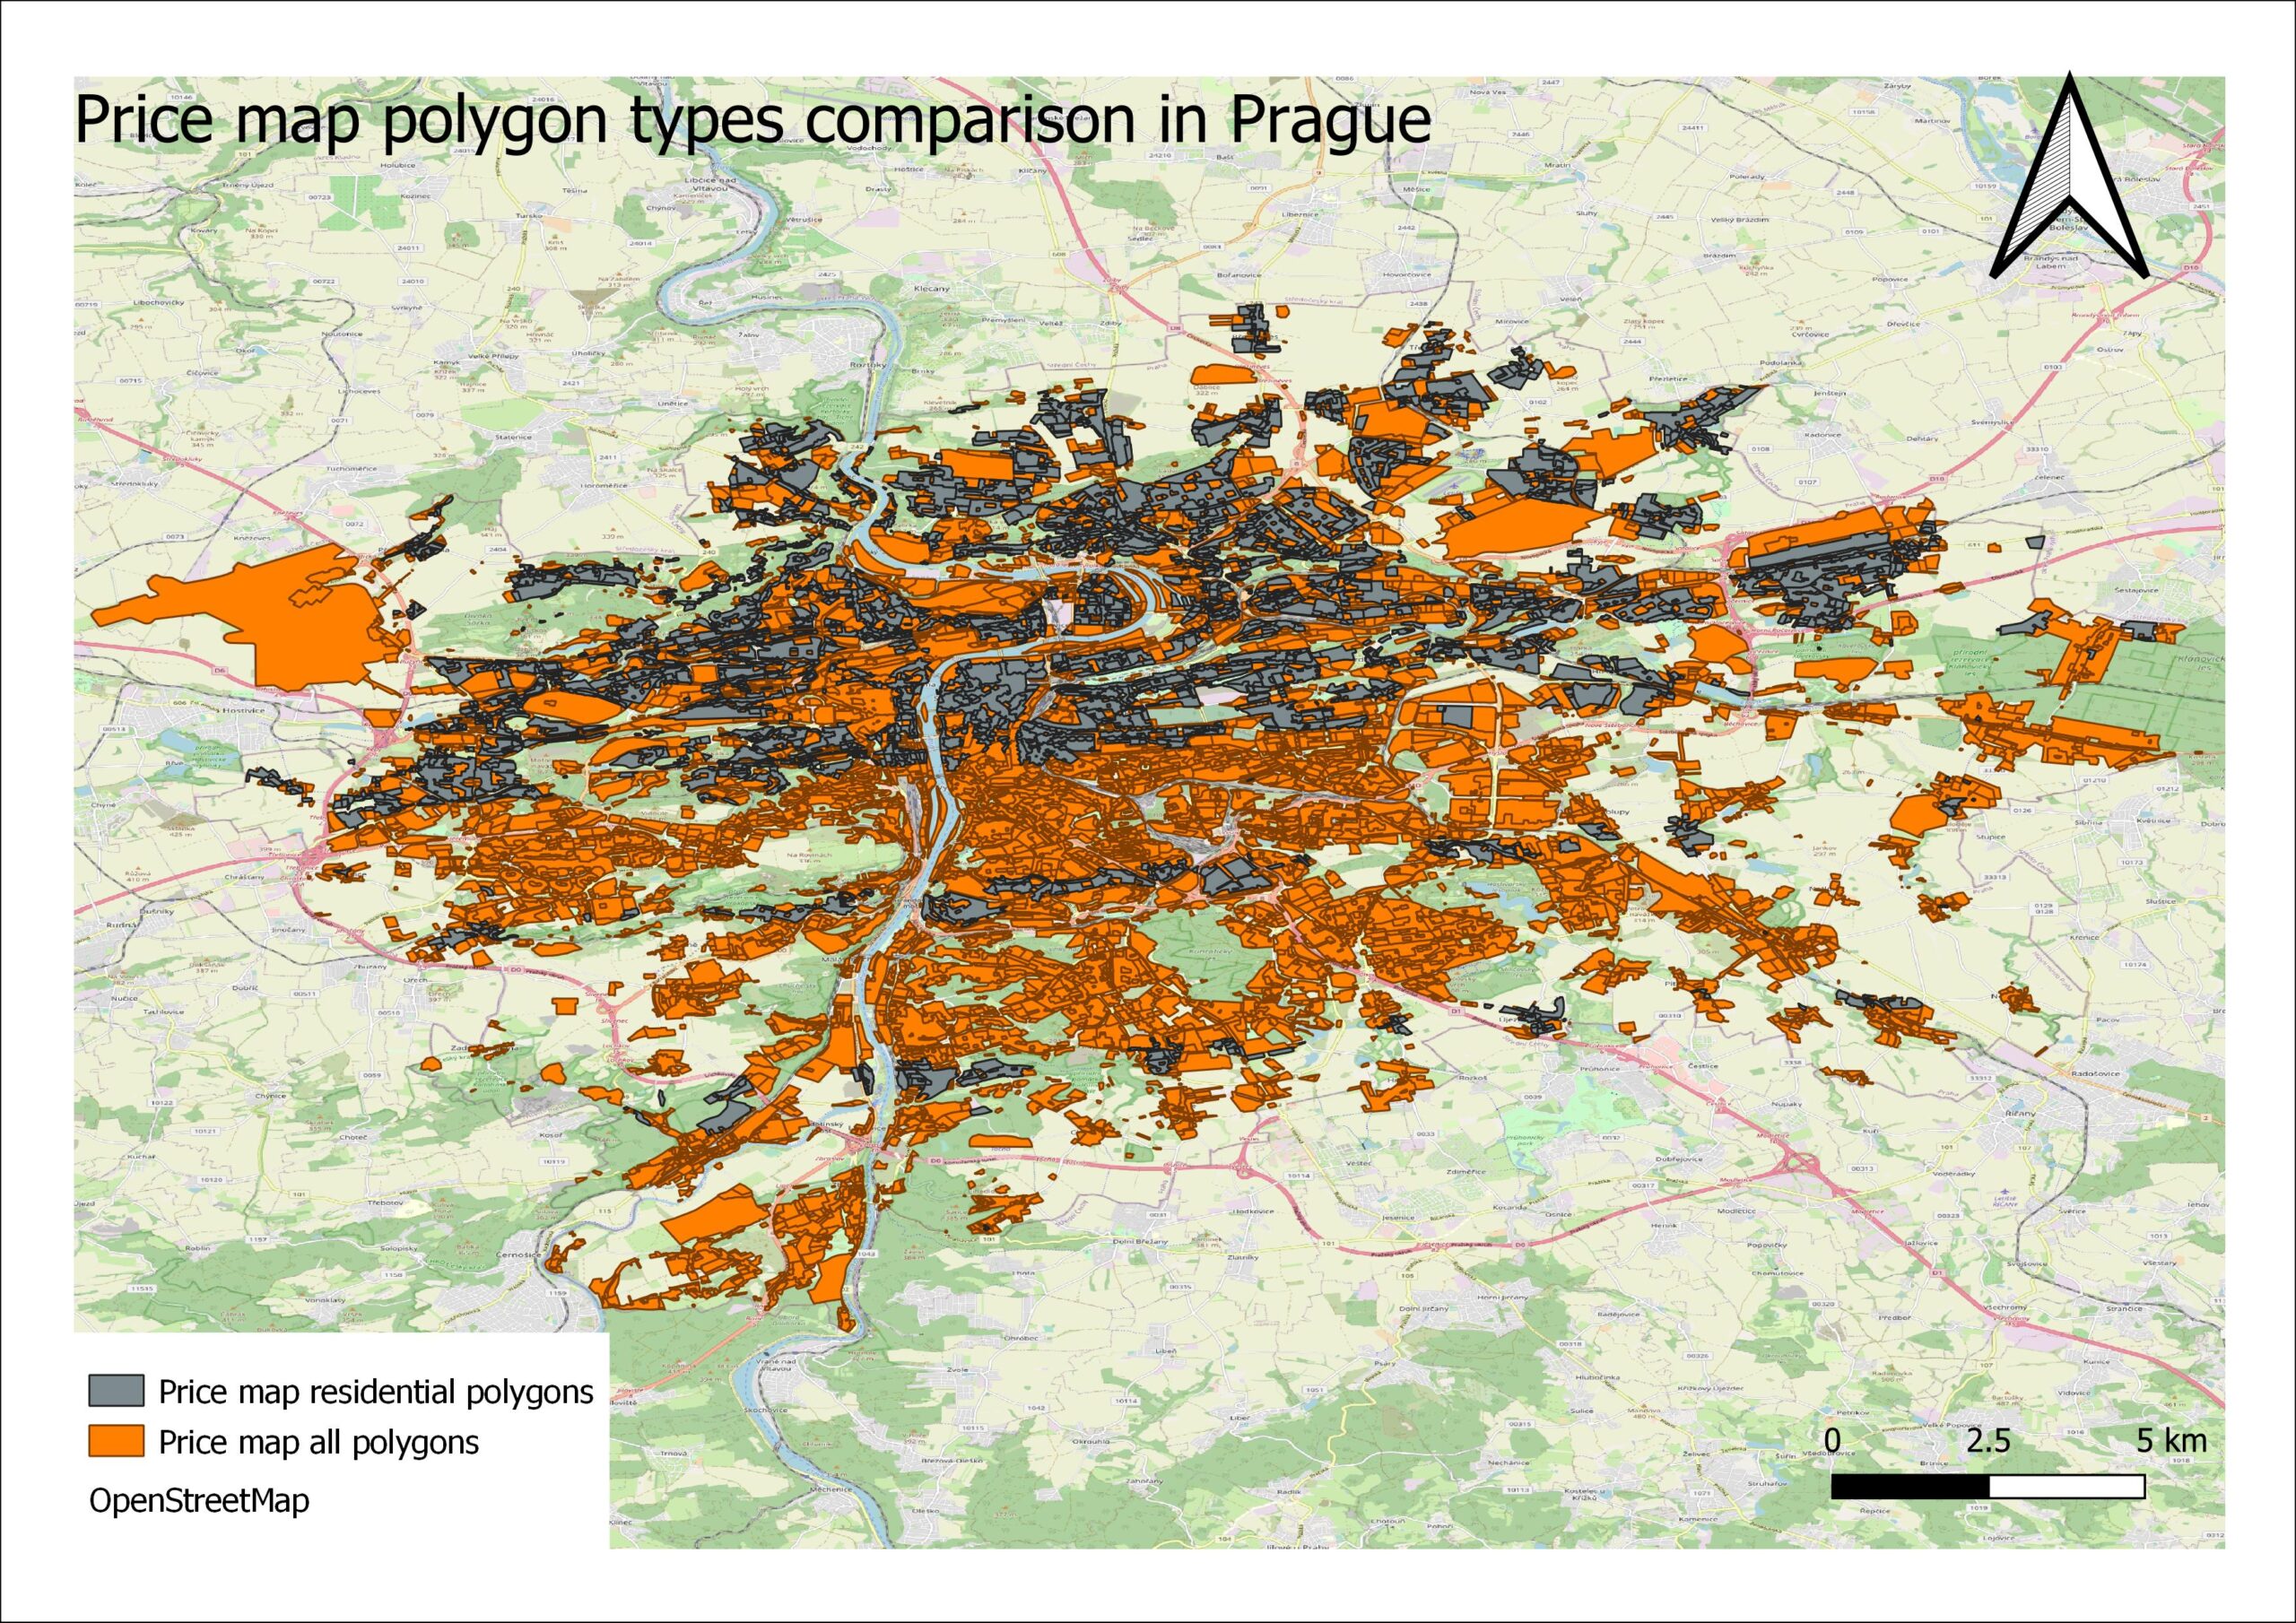
The final output is the Price map of residential areas. Each polygon represents residential or mixed area with price per square meter attribute. It represents approximately 35\% of all polygons, comparison between the original price map dataset and residential price map is depicted on the figure below.