We start by looking at all the possible interactions between the explanatory variables, however, as we know from the theoretical aspect, we know that this approach will not work. The usual rule of thumb for adding interactions is to check the interactions between low correlated variables. When the  and
and  are uncorrelated, an interaction (
 ) might exist and impacts the correlation of the coefficients. As we have already seen, the explanatory variables have high correlations therefore the approach for checking the interactions between all the explanatory variables might not be a good approach.
Modelling using Step Function in R
Continuing the modelling using step function, which performs backward automatic model selection by comparing AIC. We will consider logarithmic and cubic root transformation of the dependent variable.
Cubic root transformed response variable
This model is stated in following equation:

Where  is i-th fitted value,
  is the intercept and
  are parameters coefficients.
The model summary table is stated below. As you can see, several parameters are insignificant on 5 \% level, however step function still kept them in the model as removing them would have increased the amount of insignifant parameters and Adjusted R-squared value would have decreased.
Logarithmic transformed response variable
After discovering that cubic root transformation did not performed well in terms of significance of parameters, we decided to try logarithmic transformation of dependent variable ( The natural logarithm is being used). The model equation is stated below:

Where is i-th fitted value, is the intercept and are parameters coefficients.
Comparing two models
To choose which model performed better, we can calculate Akaike’s An Information Criterion for each model. The Akaike information criterion (AIC) is an estimator of prediction error and thereby relative quality of statistical models for a given set of data. Given a collection of models for the data, AIC estimates the quality of each model, relative to each of the other models. Thus, AIC provides a means for model selection. When comparing models fitted by maximum likelihood to the same data, the smaller the AIC the better the fit.
AIC of cubic root trasnformated model = 28.99864
AIC of log transformated model = 275.5243
By comapring AIC, we can conclude that cubic root transformed model provides better fit to the data.
Residual analysis
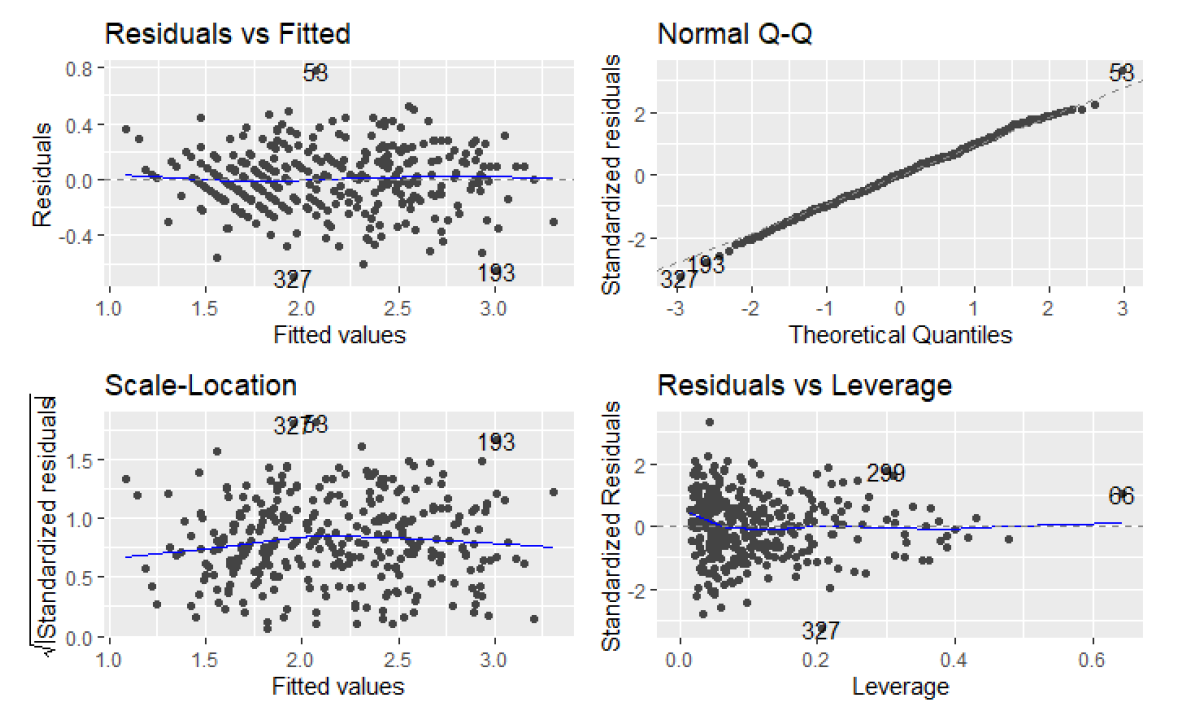
While inspecting Residuals vs Fitted plot, we can see that the observations are ordered in diagonal lines on the left half of the plot, that indicates some form of breaking of the model assumptions as the points should be randomly scattered, like starts on the night sky.
Regarding the Normal Q-Q plot, it is quite suprising that the most of the points lies on the diagonal line with only few outlying points on the tails. It can indicate overfitting as well however it is always quite tough to recognize optimal bias-variance tradeoff.
Scale-Location plot shows whether residuals are spread equally along the ranges of input variables (predictors). The assumption of equal variance (homoscedasticity) could also be checked with this plot. We can observe that majority of the points are located in the bottom half of the plot. The blue line is not much horizontal, these factors indicates breaking the assumption of variance homoscedasticity.
The Residuals vs. Leverage plots helps to identify influential data points on the model. The outliers can be influential and some points within a normal range in the model could be very influential. On the Residuals vs Leverage plot we can see one large cluster of points on the left half of the plot. Again the points should be scattered randomly to have the model assumption fullfilled.
The diagnostics plot help us to identify points that can be removed to potentially improve fit of the model. In our case, we could remove observation numbers 327, 196, 58 but we already know that we break model assumptions and the response variable does not seem to be normally distributed we decided not to spend more time into tuning of this model.