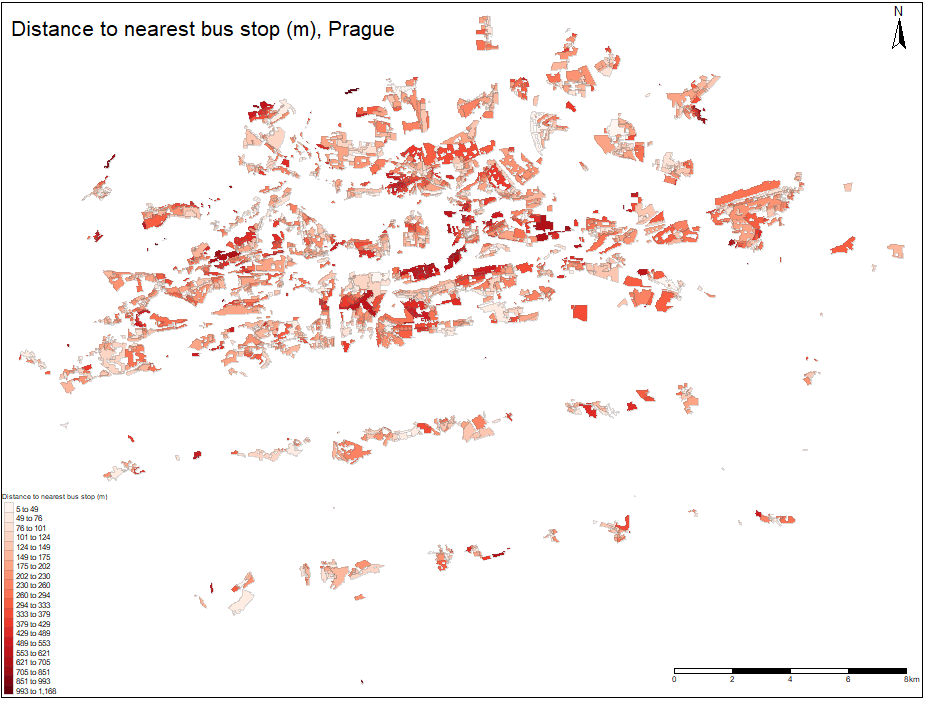
The spatial distribution of the nearest bus station distances for each polygon is depicted on the figure below. When comparing with tram and metro distances spatial distributions, the values for buses seems to be more randomly scattered, as there is no relatively low value cluster in the historical center or any apparent pattern, related with the distance to historical center. However, the comparison with previously inspected modes is not so accurate as the values‘ range is approximately eight times lower when comparing with tram and metro. It corresponds to the fact, that the bus network is way more densed as it can be observed on the figure.